The Blue Zones project was a monumental undertaking that revolutionized how we look at the intersection of health, diet, community, and other factors that lead to long healthy lives.
The project founders identified regions around the world identified as blue zones. These areas stood out to the researchers as having populations with exceptional levels of health and longevity.
Nine factors were identified as likely to contribute to the health of these blue zones populations, but only five regions in total were identified, and only one in the United States.
One thing that stood out to us: this small amount of official blue zones means that many of them are out of reach. Although a summer vacation is in the cards, many of us aren’t going to pack our bags and move to Sardinia.
So that got us wondering, can we align those same factors that define blue zones with similar county-level data to generate our own findings of the healthiest, highest “blue score” county in every state across the U.S.?
After countless hours of number crunching we’re happy to reveal the results:
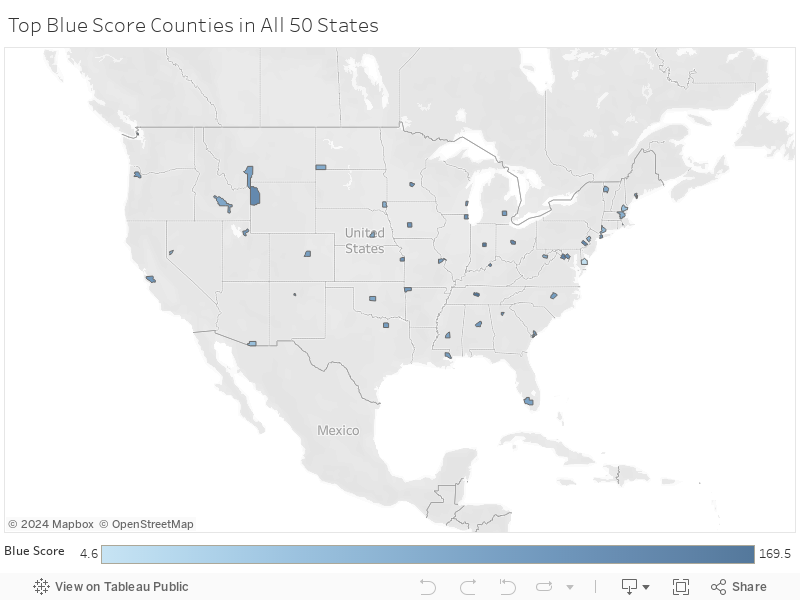
Top Blue Score County Rankings
Here are the 50 counties, one for each state, that have the highest blue score, as compiled by us:
| State | County | Life Expectancy | Blue Score |
| Tennessee | Williamson | 82.1 | 169.48 |
| Indiana | Hamilton | 82 | 163.10 |
| Virginia | Loudoun | 84.3 | 146.33 |
| Ohio | Delaware | 82.6 | 139.25 |
| Pennsylvania | Montgomery | 80.9 | 136.31 |
| Wyoming | Teton | 87.4 | 133.84 |
| Georgia | Forsyth | 81.5 | 129.76 |
| Kentucky | Oldham | 79.6 | 125.16 |
| Illinois | Lake | 81.6 | 123.76 |
| Minnesota | Carver | 83.1 | 122.51 |
| Maryland | Montgomery | 84.3 | 122.48 |
| Iowa | Dallas | 82.6 | 122.14 |
| Kansas | Johnson | 82 | 121.38 |
| New York | Nassau | 82.8 | 119.65 |
| Alabama | Shelby | 80.4 | 111.52 |
| New Mexico | Los Alamos | 83.8 | 111.45 |
| California | Santa Clara | 84.4 | 111.26 |
| Oregon | Washington | 82.5 | 110.41 |
| Wisconsin | Ozaukee | 82 | 110.07 |
| Utah | Morgan | 81.3 | 109.75 |
| Alaska | Haines | 85.1 | 108.13 |
| Arkansas | Benton | 79.6 | 107.08 |
| South Carolina | Beaufort | 82.5 | 105.52 |
| Michigan | Livingston | 80.8 | 105.44 |
| North Carolina | Wake | 81.5 | 103.45 |
| Louisiana | St. Tammany | 78.7 | 103.10 |
| Texas | Collin | 82.7 | 102.84 |
| Missouri | St. Charles | 80.4 | 102.49 |
| Washington | San Juan | 84.2 | 101.99 |
| Colorado | Douglas | 84 | 101.62 |
| Montana | Gallatin | 82.3 | 99.04 |
| Mississippi | Rankin | 79 | 94.10 |
| Florida | Collier | 85.9 | 93.70 |
| Oklahoma | Canadian | 78.5 | 89.83 |
| Maine | Sagadahoc | 79.3 | 89.57 |
| Vermont | Chittenden | 81.6 | 88.87 |
| Idaho | Blaine | 84.9 | 88.26 |
| West Virginia | Tucker | 78.1 | 84.67 |
| North Dakota | Bowman | 82.7 | 82.41 |
| South Dakota | Lincoln | 84 | 77.67 |
| New Jersey | Hunterdon | 83.1 | 77.60 |
| Nevada | Storey | 89.5 | 74.49 |
| Massachusetts | Middlesex | 82 | 74.34 |
| Nebraska | Hamilton | 81.7 | 73.00 |
| Connecticut | Fairfield | 82.6 | 65.55 |
| Arizona | Santa Cruz | 83.2 | 52.51 |
| New Hampshire | Rockingham | 80.4 | 52.37 |
| Rhode Island | Bristol | 81.4 | 38.61 |
| Hawaii | Honolulu | 82.5 | 37.56 |
| Delaware | Sussex | 78.5 | 4.59 |
Key Findings
- Contrary to popular belief, some of the highest-scoring counties were not in health-obsessed states like California, but southern and midwestern states like Tennessee and Indiana.
- Counties with higher household wealth tended to have high overall blue scores, as shown by Williamson county, Tennessee which is also one of the wealthiest.
- Top scoring counties are often clustered near each other, such as Santa Clara, San Mateo, and Marin counties in California.
Methodology for the Creating Blue Score
The author of the Blue Zones book, Buettner, identified a list of nine lessons, covering the lifestyle of blue zones people:
- Moderate, regular physical activity.
- Life purpose.
- Stress reduction.
- Moderate caloric intake.
- Plant-based diet.
- Moderate alcohol intake, especially wine.
- Engagement in spirituality or religion.
- Engagement in family life.
- Engagement in social life.
We then found similar data sources in government data sets that best aligned with these nine factors, and mapped them as follows:
Blue Zone® Lesson | Blue Score Factor |
| 1. Moderate, regular physical activity. | % Physically Inactive |
| 2. Life purpose. | Mentally Unhealthy Days |
| 3. Stress | % Uninsured |
| % Unemployed | |
| % Children in Poverty | |
| Income Ratio | |
| 4. Moderate caloric intake. | % Obese |
| 5. Plant-based diet. | Food Environment Index |
| 6. Moderate alcohol intake, especially wine. | % Excessive Drinking |
| 7. Engagement in spirituality/religion | Community Health |
| 8. Engagement in family life. | Family Unity |
| 9. Engagement in social life. | Association Rate |
As a 10th factor, we also included life expectancy in the computation. We computed the z-score for every county in each state, and averaged the z-score to come up with our composite score, the Blue Score. Then we ranked the counties at a state level to show the top county in every state.
Sources:
We compiled data from the County Health Rankings & Roadmaps project as well as the Social Capital Index.
Disclaimer:
The study was created for informational purposes only. Reservations.com has no sponsorship by or affiliation with Blue Zones, our BLUE ZONES brand, or Dan Buettner. This study is making no reference or claim to the official Blue Zones regions.